Data ingestion

Data supported

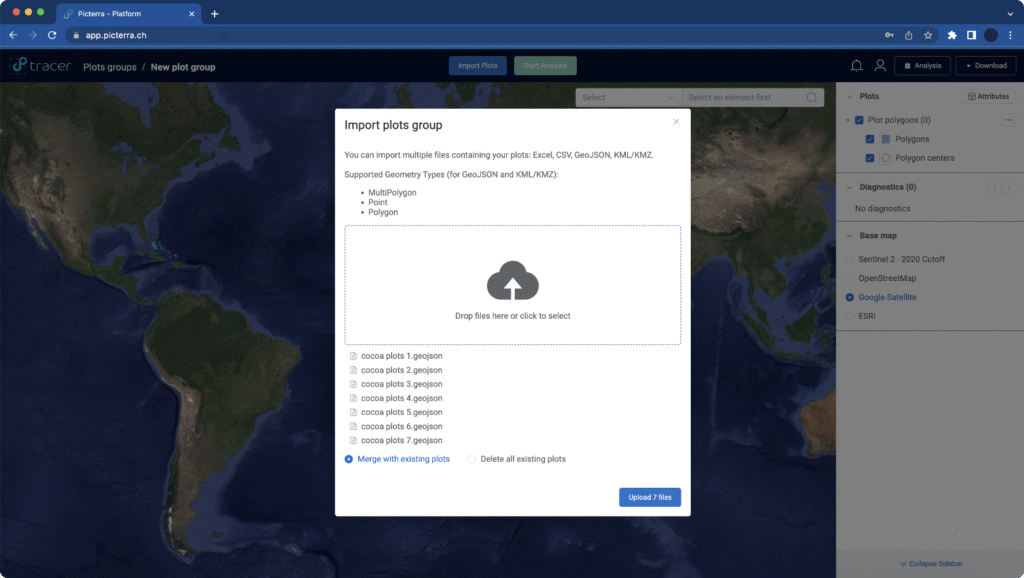
Picterra Tracer enables customers to upload and download various data formats, including Excel sheets, CSV, KML, KMZ, and GeoJSON files.

GeoJSON is the preferred data format supported by Picterra Tracer.

It supports the following geometry types:

  • Point
  • Polygon
  • MultiPolygon

Additionally, properties can be included to represent all information associated with each geometry.

For tabular data, Picterra Tracer requires the following columns to create a geometry:

  • Longitude
  • Latitude
  • Area (ha)

When using tabular data as a source to generate Polygon geometries, each row should include the longitude and latitude of the center, along with its associated area in hectares. Tracer will automatically create a circle that approximates your plot using this information.

Any properties (columns for tabular data) added to your data will automatically appear in the attribute table and can be used to search and filter your data.

Learn more about the attributes table

Please ensure that each property is consistently defined across all geometries. For example, if the property “Area” is included, it must be specified for every point, polygon, or multipolygon in the dataset.Here is an exhaustive list of the required fields for any type of data:

Base requirements for all methodologies:

  • Plot_id (if not provided Picterra Tracer will generate one)
  • Geometry (geometry files)
  • Latitude & Longitude (tabular data)

EUDR methodology

  • Area (ha) – Picterra Tracer will calculate this unless your geometry is a Point type.

To ensure your data is imported correctly, our Customer Success team will assist you throughout the upload process of the above formats. If you need to use any of these formats, please reach out to the Customer Success Contact Point assigned to your account.

Uploading multiple files

Picterra Tracer allows you to import data even when it’s spread across multiple files. Just ensure that each plot has a unique ID — this makes it much easier to update your plots later. If you haven’t assigned a Plot ID, don’t worry — Tracer will automatically generate one for you.

To help you understanding the upload process, here are two common cases:

Files with the same format and structure

If you have several files (like KML or GeoJSON) that use the same columns and setup, you can use the multiple file import feature to upload them all at once.

Files with different formats or structures

If your files are not consistent (for example, mixing KMLs and Excel files) you should upload them by type. Please, do not try to import files with different structures at the same time.

Important: Please, be aware of how the system updates your data. For example, if you upload KML files first (which have good map shapes), and then import an Excel with attributes including coordinates, Picterra Tracer will replace the shapes from the KMLs with the latitude and longitude from the Excel file.

Data quality check

Picterra Tracer ensures data accuracy through automated verification and correction processes. It:

  • Validates imported data to detect inconsistencies or errors.
  • Automatically corrects common geometry issues, such as self-intersection.
  • Enhances data reliability for further analysis, compliance verification, and reporting.

This streamlined approach ensures clean, accurate, and ready-to-use geospatial data. 

For more information about our data cleaning process, existing customers can refer to the documentation provided during onboarding or request it directly from the Customer Success Contact Point assigned to their account.

Warnings & errors

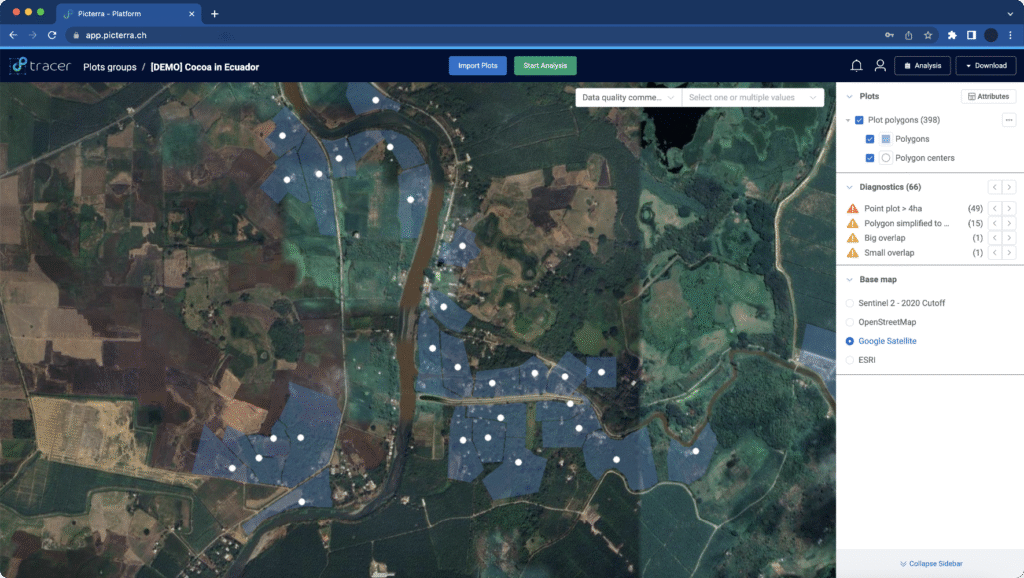
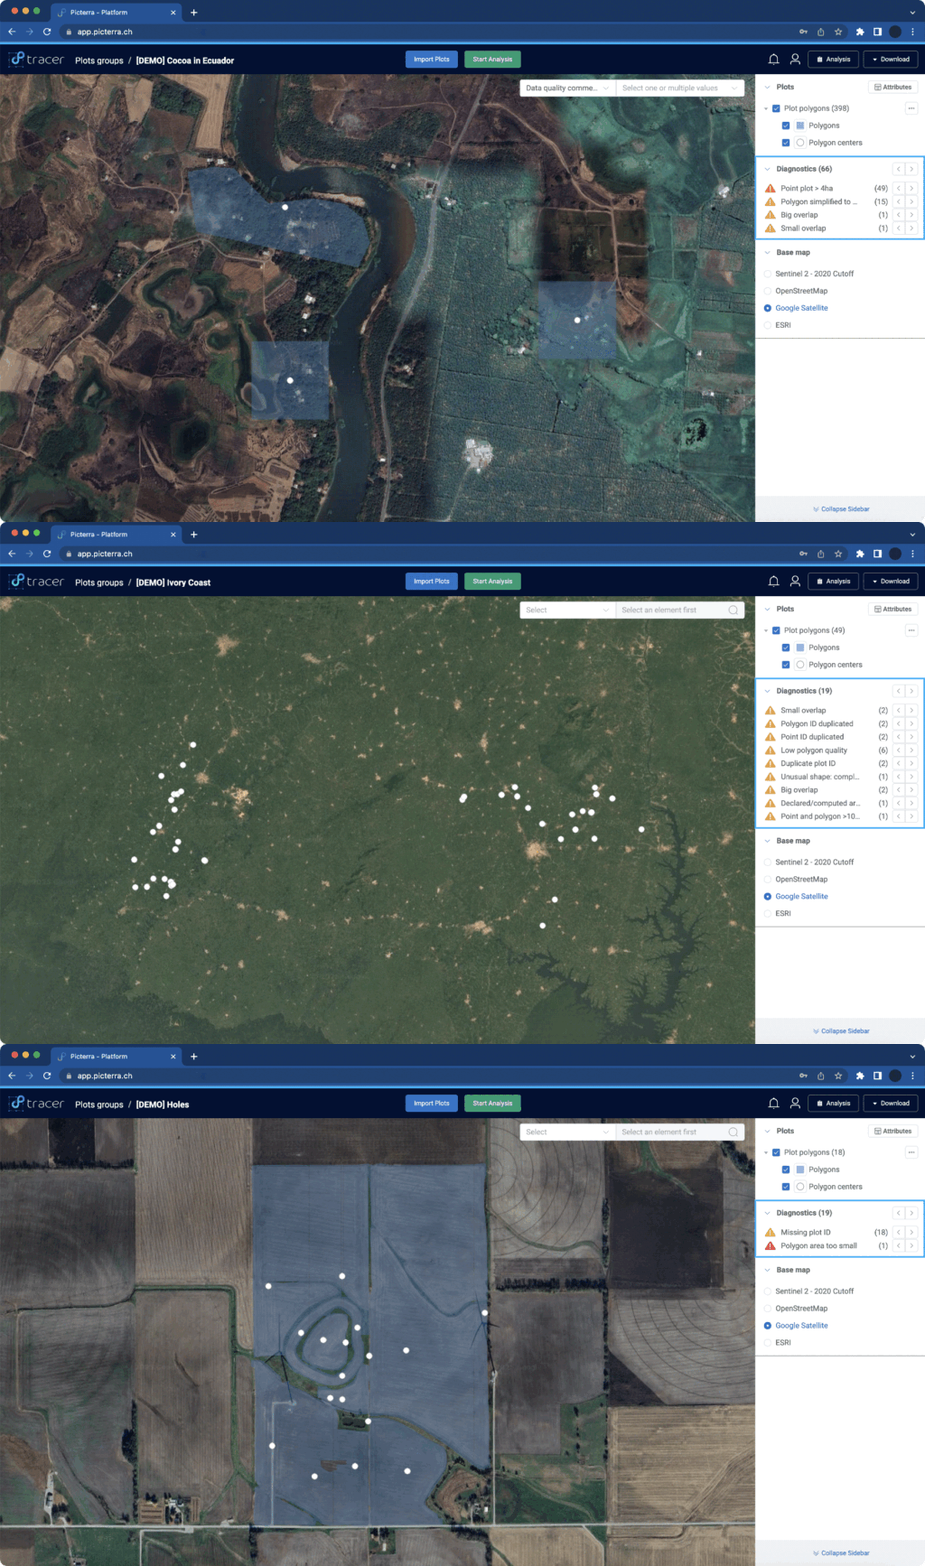
It can also detect and highlight several geometry issues:

Duplicate geometries

polygons or plot duplicates.

Invalid geometry

Detected geometry issues in the uploaded polygons.

Incorrect location

Points or polygons located outside of the country

Low quality data

Points or polygons that have been flagged by Tracer, during the quality verification process due to incomplete or missing data.

Incorrect or incompatible data

Points or polygons that have been flagged as incorrect or incompatible based on the methodology in use.

Any issues detected are clearly flagged in the user interface and reflected in the attribute table, accompanied by detailed warnings and error indicators to support resolution.

Icon Category Action
InfoNo action is required. This message is for informational purposes only and indicates that an automatic correction has been applied to the plot.
WarningNo action is required for analysis, but Picterra recommends reviewing this plot with the supplier for verification.
ErrorThis plot can be analyzed, but the results may be unreliable or incompatible with methodology requirements (e.g., non-EUDR compliant). Picterra recommends verifying with the supplier.
Critical ErrorThis plot cannot be analyzed due to errors that obstruct the analysis process.

For more information about warnings and errors, existing customers can refer to the documentation provided during onboarding or request it directly from the Customer Success Contact Point assigned to their account.

Data correction

Picterra Tracer can automatically correct a selection of  geometry issues including but not limited to.:

  • Valid geometries
  • Vertices integrity

For more information about our data correction process, existing customers can refer to the documentation provided during onboarding or request it directly from the Customer Success Contact Point assigned to their account.