





EUDR Methodology
Picterra is committed to supporting compliance with the EU Deforestation Regulation (EUDR) by providing robust, scalable tools to help organizations assess and minimize the risk of deforestation and forest degradation in their supply chains, while guiding their potential mitigation measures.
Methodology overview
Our deforestation risk assessment methodology is designed to categorize agricultural sourcing plots based on the risk of recent deforestation, using a transparent, reproducible, and spatially explicit process.
We assess the following EUDR-regulated commodities:
Picterra’s analysis combines authoritative global forest layers datasets, national forest inventories, as well as higher spatial resolution Earth Observation satellite imagery to unveil ambiguous cases where needed, to determine deforestation risk for each plot.
Picterra’s methodology builds on the convergence of evidence (FAO/GIZ WHISP “What’s in this plot”) approach, integrating, intersecting and analyzing multiple layers for undisturbed forest cover in 2020, plantation maps in 2020 and deforestation alerts in order to maximize information while enabling simple, traceable risk categorization.

Data conformity
Picterra Tracer ensures data accuracy through automated verification and correction processes.
Any issues detected are clearly flagged in the user interface and reflected in the attribute table, accompanied by detailed warnings and error indicators to support resolution.
Depending on the severity of the issue, Picterra Tracer may prevent the creation of EUDR reports to ensure compliance.
Icon | Category | Conformity(EUDR) | Action |
|---|---|---|---|
Info | Conform | No action is required. This message is for informational purposes only and indicates that an automatic correction has been applied to the plot. | |
Warning | Conform | No action is required for analysis, but Picterra recommends reviewing this plot with the supplier for verification. | |
Error | Not Conform | This plot can be analyzed, but the results may be unreliable or incompatible with methodology requirements (e.g., non-EUDR compliant). Picterra recommends verifying with the supplier. | |
Critical Error | Not conform | This plot cannot be analyzed due to errors that obstruct the analysis process. |
Deforestation risk assessment
Risk classification approach
Our approach to identifying deforestation risk is based on three key steps:
Authoritative mapping layers.
Note: For a detailed list of mapping layers used in this assessment, existing customers can refer to the technical documentation provided during onboarding or request it directly from their assigned Customer Success Contact Point
Plot-level risk classification.
Resolving uncertainty.
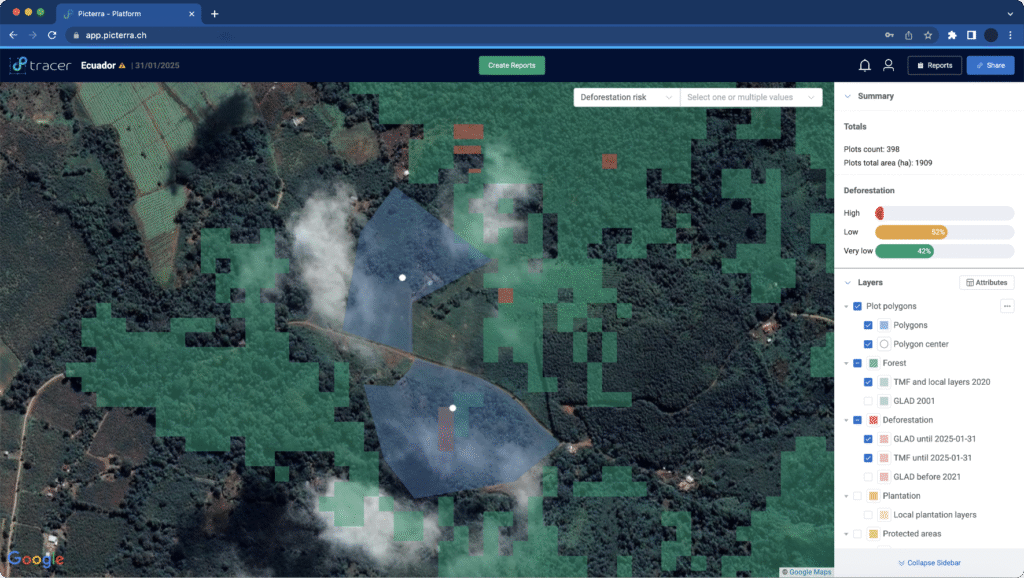
Plots are analyzed and assigned one of three deforestation risk levels related to the presence of a negligeable or non-negligeable deforestation risk according to EUDR:
High risk - non-negligeable risk
Low risk - negligeable risk
Very low risk - negligeable risk

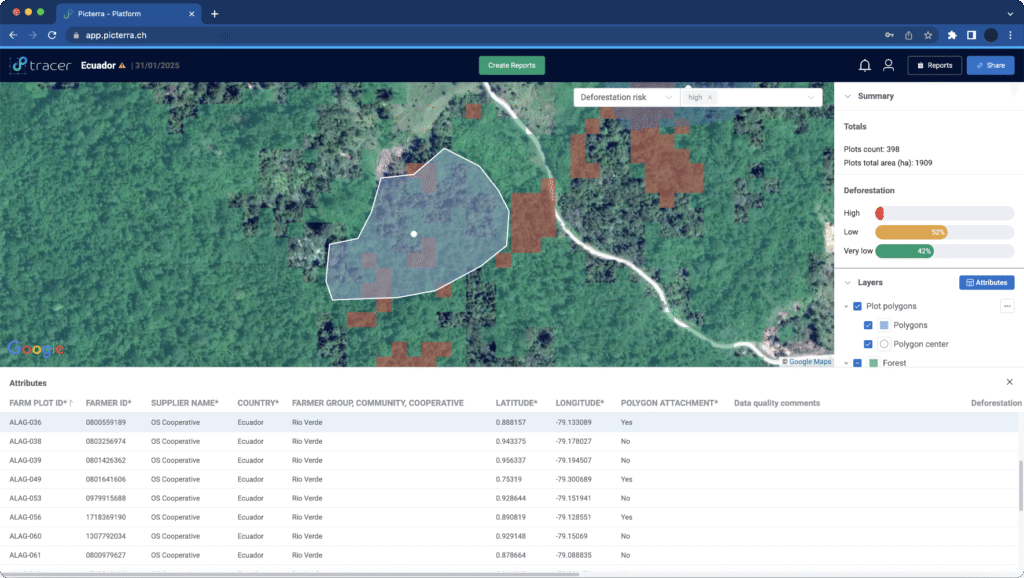
The assigned deforestation risk levels are automatically recorded in the attribute table under the designated attribute name, using one of the accepted values: high, low, or very low.
| Methodology | Attribute name | Attribute values |
| EUDR | Deforestation risk |

Deforestation risk analysis – workflow
The following schematic outlines a structured sequence of the classification logic and criteria used to evaluate deforestation risk:
Deforestation Analysis Methodology
Convergence of evidences approach (c.f. FAO WHISP methodology)
Global & regional data
- Forest
- Plantations
Local detections
- Native forest
- Plantation forest
- Plantations
Alerts
Global forest layers:
Local plantation layer:
Global tree cover loss alerts:
Global plantation layers:
Proprietary plantation layer:
Satellite imagery:
1. Global & regional data
- Forest
- Plantations
Global forest layers:
Global plantation layers:
2. Local detections
- Native forest
- Plantation forest
- Plantations
Local plantation layer:
Proprietary plantation layer:
3. Alerts
Global tree cover loss alerts:
Satellite imagery:
The deforestation analysis starts by sorting farm plots into two main categories based on how the land is used:
- Likely to contain forest: areas with a lot of dense forest cover.
- Unlikely to contain forest: areas used for agriculture, mainly plantations, with only small patches of forest.
Then, each plot is assigned a risk level based on detected signs of deforestation, and indicated with the alerts.
Plot risk reclassification
Picterra Tracer supports per-plot deforestation risk reclassification, enabling users to override the automatically computed risk level to confirm or correct it ie in case the automated deforestation analysis produced ambiguous or false-positive results or editional evidence is available from the field audits.
Reclassification can be applied following complimentary deforestation level 2 assessment.
Deforestation risk level 2 assessment
To conduct deforestation level 2 risk assessment, two types of evidence are accepted:
Remote sensing evidence
Certified verification evidence
The results of Level 2 assessment must be manually entered into the attribute table under the designated attribute name, using one of the accepted values: ‘high’, ‘low’, or ‘very low’.
| Methodology | Attribute name | Attribute values |
| EUDR | Deforestation risk level 2 |
Additionally, a spreadsheet can be uploaded containing the relevant plot IDs along with a column titled “Deforestation risk level 2 description”, where the supporting evidence for each reclassification can be documented.
Once a plot is assigned a “Deforestation risk level 2” value, Picterra Tracer will override the automatically computed risk with this manually provided classification.
This process ensures traceability and gives users the flexibility to validate exceptional cases without compromising consistency across large-scale datasets.
Level 2 assessment through remote sensing
Picterra offers a Deforestation risk level 2 analysis advanced assessment that leverages very high-resolution satellite imagery (50 cm or 30 cm) from two time points (prior to the cut-off date and the most recent), and machine learning deforestation models to precisely verify the deforestation status.
More information about this process can be provided by the Customer Success Contact Point assigned to the customer account.
Reclassification workflow
There are two ways to execute per-plot deforestation risk reclassification once the Deforestation level 2 results are available:
- Pre-analysis (pre-tagging)
- Post-analysis (using “parent analysis flow” to avoid changing other results)
Pre- analysis
If you have verified evidence of the deforestation risk for a given plot (e.g. results from a ground audit), you can assign the “Deforestation risk level 2” attribute before running the analysis.
This value will then be applied directly to the plot’s “Deforestation risk” field, along with a note indicating that the classification was based on a Level 2 assessment — no further action is needed.
Post-analysis with parent analysis flow
If you have already completed an analysis and a plot was flagged as “high risk,” but you have since conducted a Level 2 deforestation risk assessment that justifies reclassifying the plot to “low” or “very low” risk, you can update the classification in two ways:
Update the “Deforestation risk level 2” attribute and re-run the analysis
Update the “Deforestation risk level 2” attribute and use the “parent analysis” flow
Why use the parent analysis flow?
Re-running an analysis may lead to changes in the results of other plots if the underlying methodology or global Earth observation layers have been updated.
The parent analysis flow avoids this by:
- Copying all results from the original (parent) analysis without re-processing.
- Overriding the “Deforestation risk” value only for plots that have a “Deforestation risk level 2” set.
This ensures stability of the original results while allowing selective updates based on verified evidence.
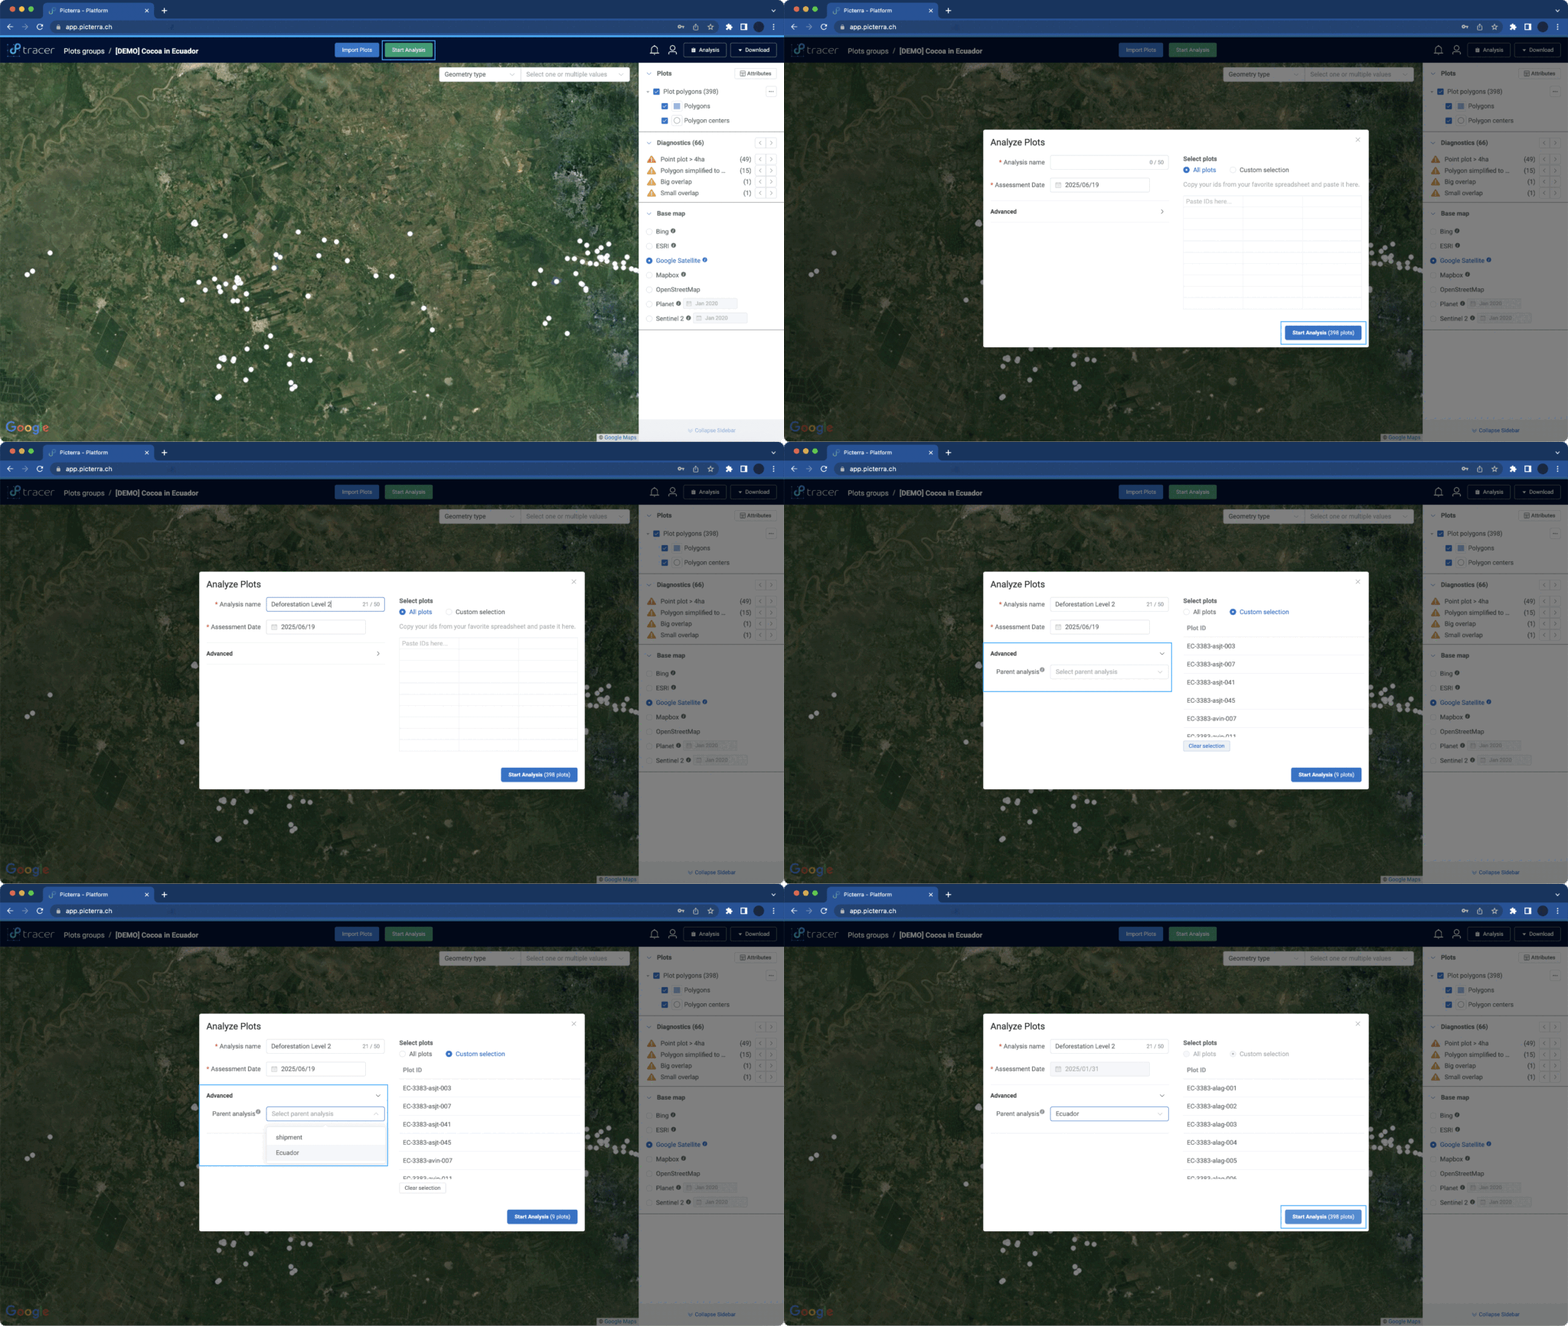
How to run a new analysis with a parent analysis:
To use the parent analysis option:
- Click on the “Start Analysis” button
- Expand the “Advanced” section of the “Analyze plots” pop up
- Select the relevant parent analysis from the dropdown
- Click “Start analysis” to create the new analysis using the inherited results and Level 2 overrides.

Note that in this mode, you can’t select plot ids anymore because this is going to reuse the plot ids from the parent analysis.
Submission to EU TRACES NT
Picterra Tracer supports export of risk assessments in formats compliant with EU TRACES NT platform specifications, including:
- Point / MultiPoint (for plots ≤ 4ha using GPS coordinates)
- Polygon / MultiPolygon (for plots > 4ha using geospatial boundaries)
The data structure follows the EU GeoJSON file schema (v1.4, Nov 2024):
See latest specification here
Protected areas
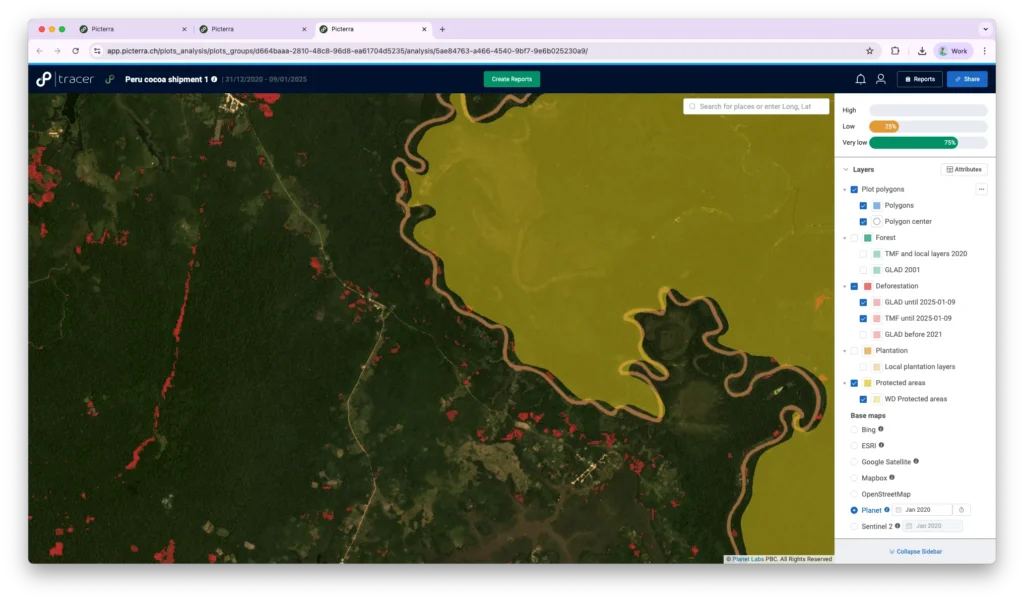
In the analysis result view, you will also be able to visualize the extent of protected areas.

If one of your plots is within 1 km of a protected area, you should conduct an on-the-ground investigation to determine if the plot is actually inside a protected area.
The boundaries of protected areas come from the WDPA dataset.
Protected Area, Key Biodiversity Area, and Species data reproduced and incorporated under licence from the Integrated Biodiversity Assessment Tool (IBAT) (https://www.ibat-alliance.org/). IBAT is provided by BirdLife International, Conservation International, IUCN and UNEP-WCMC. Contact ibat@ibat-alliance.org for further information.