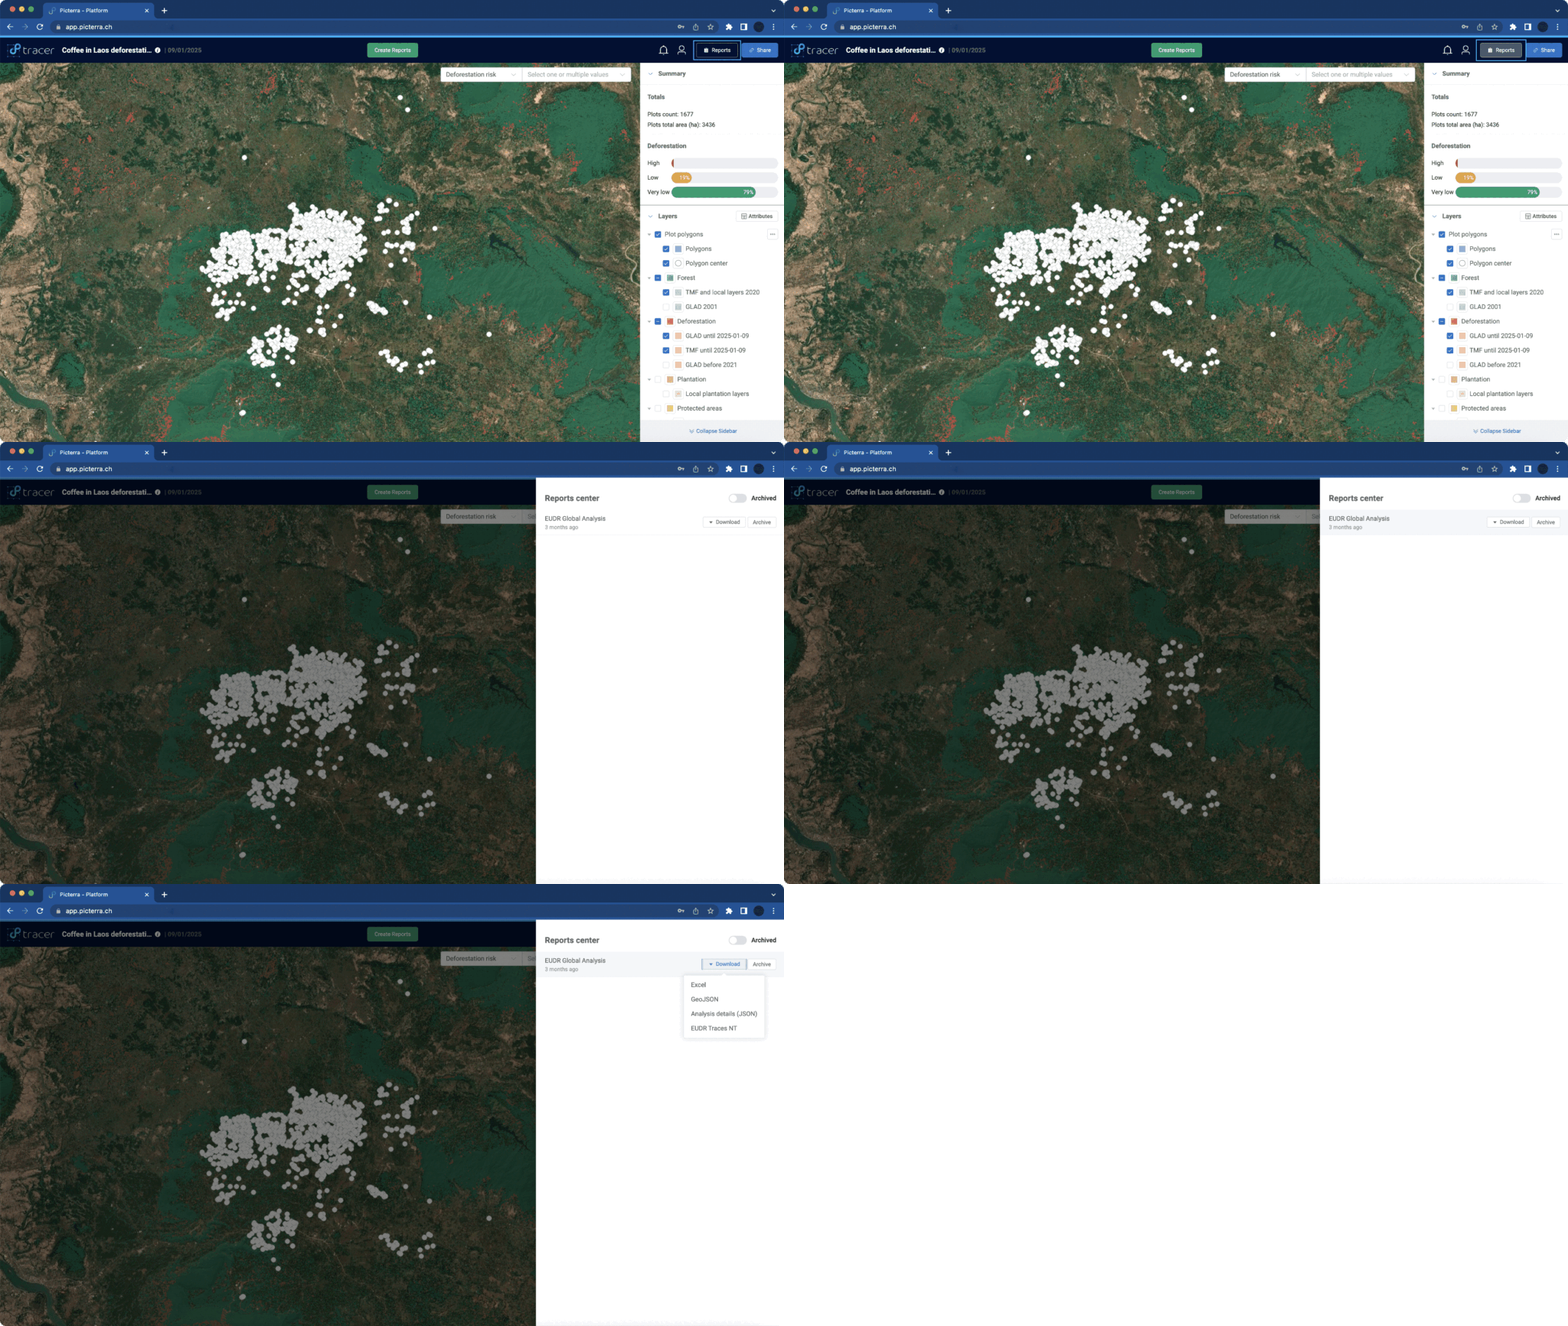
Reports
Generate a report
The Analysis View allows users to generate reports that compile all insights derived from the plot analysis.
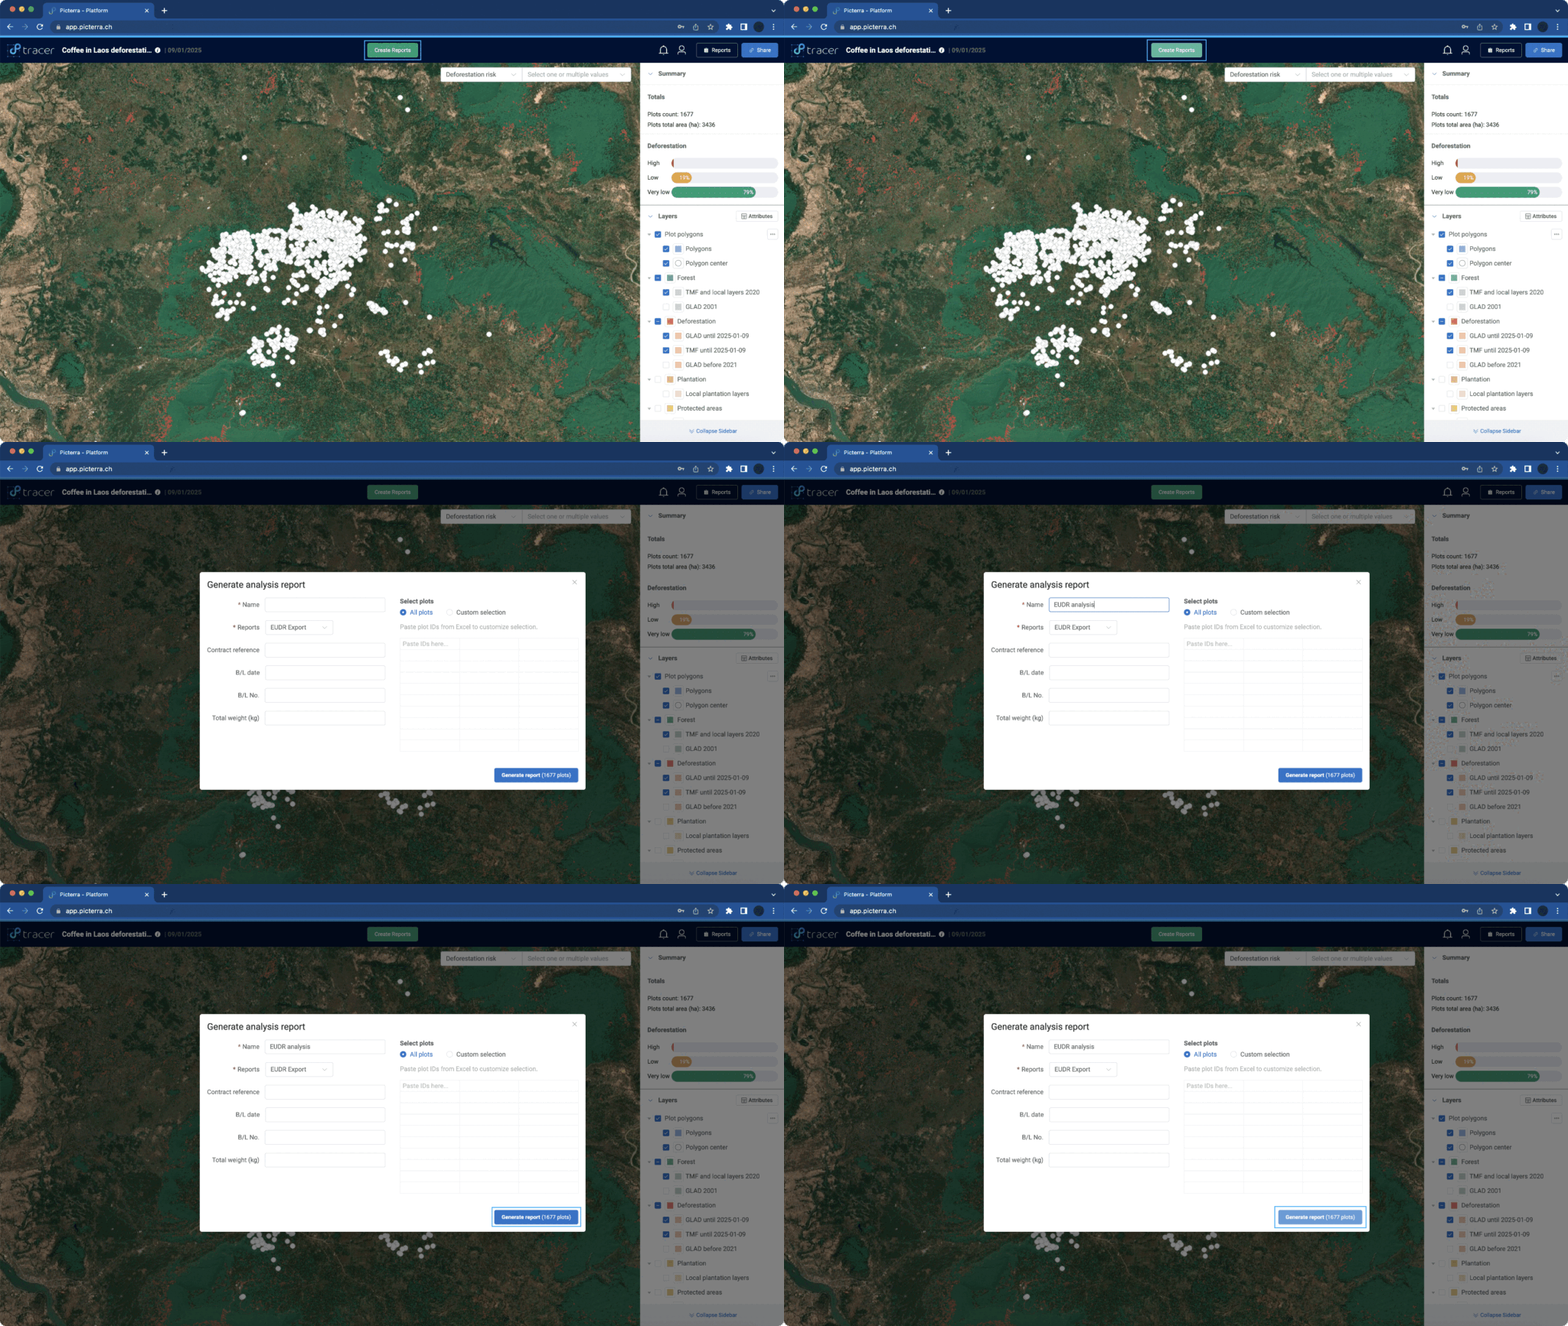
To create a report, click the green “Create Report” button in the top bar. A popup window will appear, where you can define the following parameters:
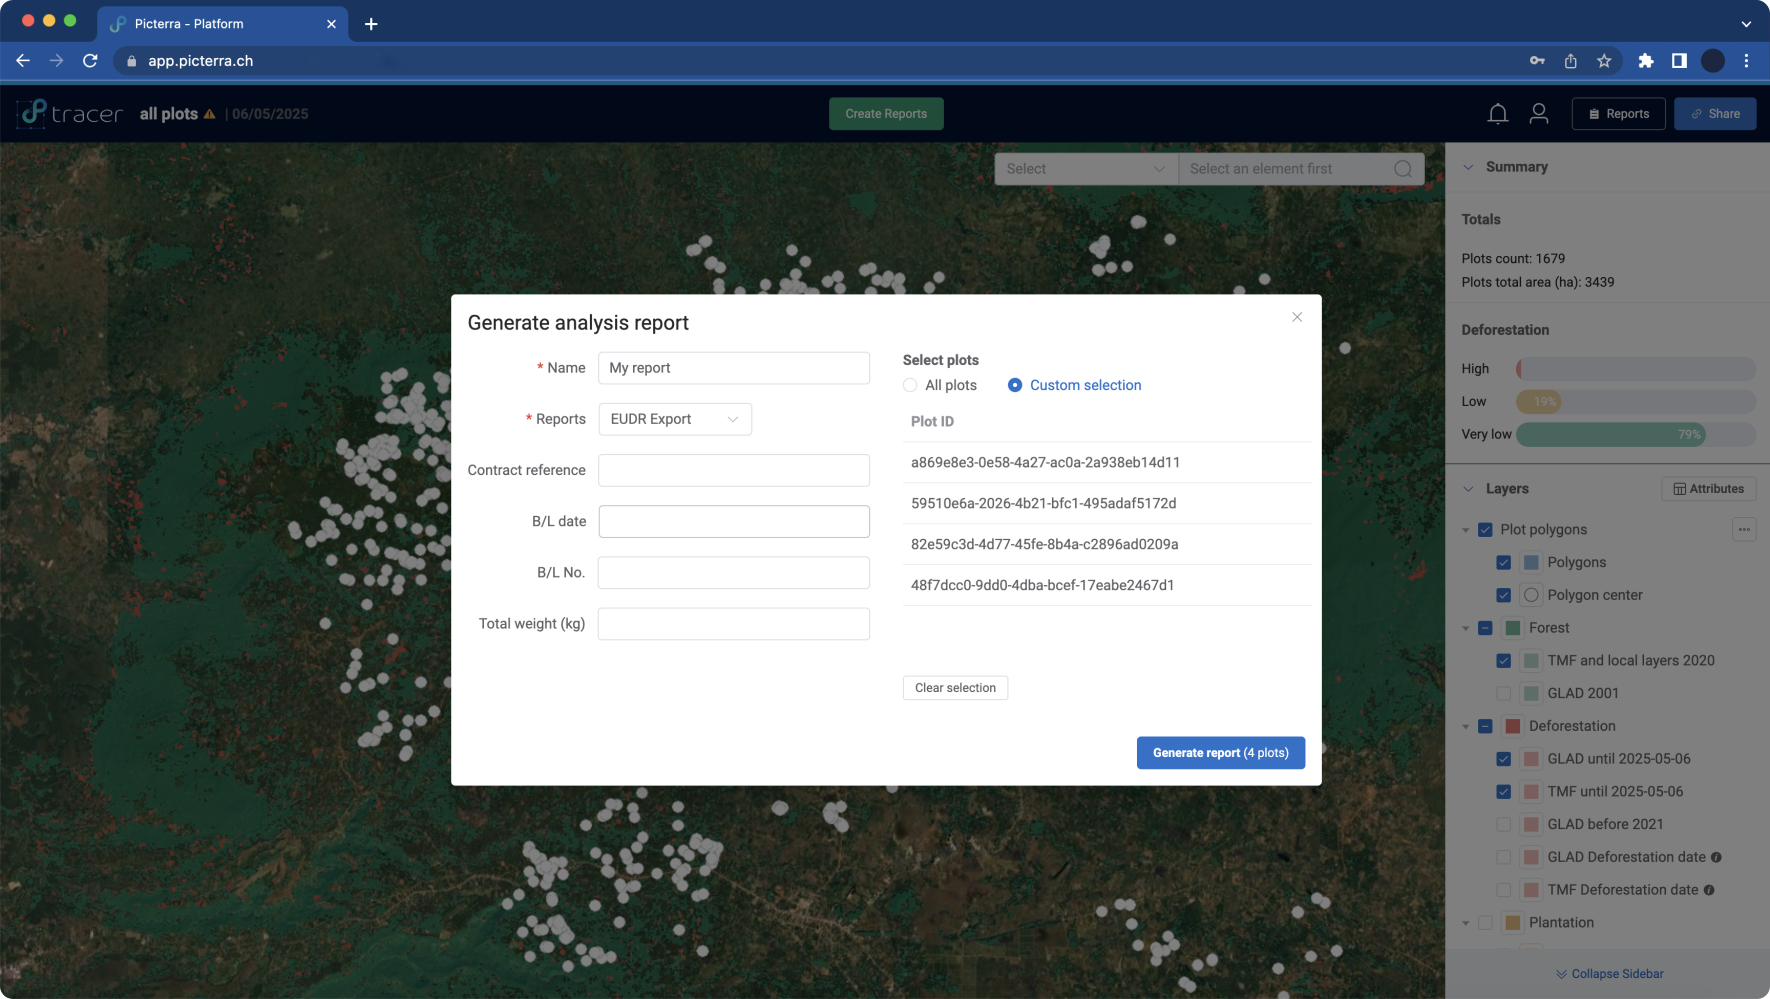
Standard fields:
- Report Name – Assign a clear and descriptive title to your report.
- Report Type – Choose the type of the report to ensure the appropriate downloadable format is generated.
Custom fields:
In some cases, you may need to include data fields in your report that reflect your internal workflows. To support this, we can add custom fields — such as contract references or purchase order numbers — to ensure seamless integration with your ERP or CRM systems.
Plot Selection:
By default, all plots are selected. You can manually select or deselect individual plots, or use the “select all / deselect all” options as needed.
When working with large datasets, you can quickly select plots by copying plot IDs from Excel, CSV, or similar formats and pasting them into the table on the right-hand side.
Tip
Downloading plot groups in Excel format makes it easier to review the data and select specific subgroups to copy/paste for generating reports.
After configuring the report parameters, click the “Generate Report” button in the bottom-right corner. Picterra Tracer will process the report and notify you once it is available.
Download reports
You can access the list of all created Reports from the Analysis View by clicking “Reports” on the top bar. This will open a right-side pop-up displaying all reports created so far.
Next to each report name, you’ll find a “Download” button, which allows you to download the report in different formats:
- Excel
- Geogeson
- Analysis GeoJSON
- Methodology related formats:
EUDR
- Excel
- GeoJSON
- Analysis details (JSON)
- EUDR Traces NT