Analysis
Generate an analysis
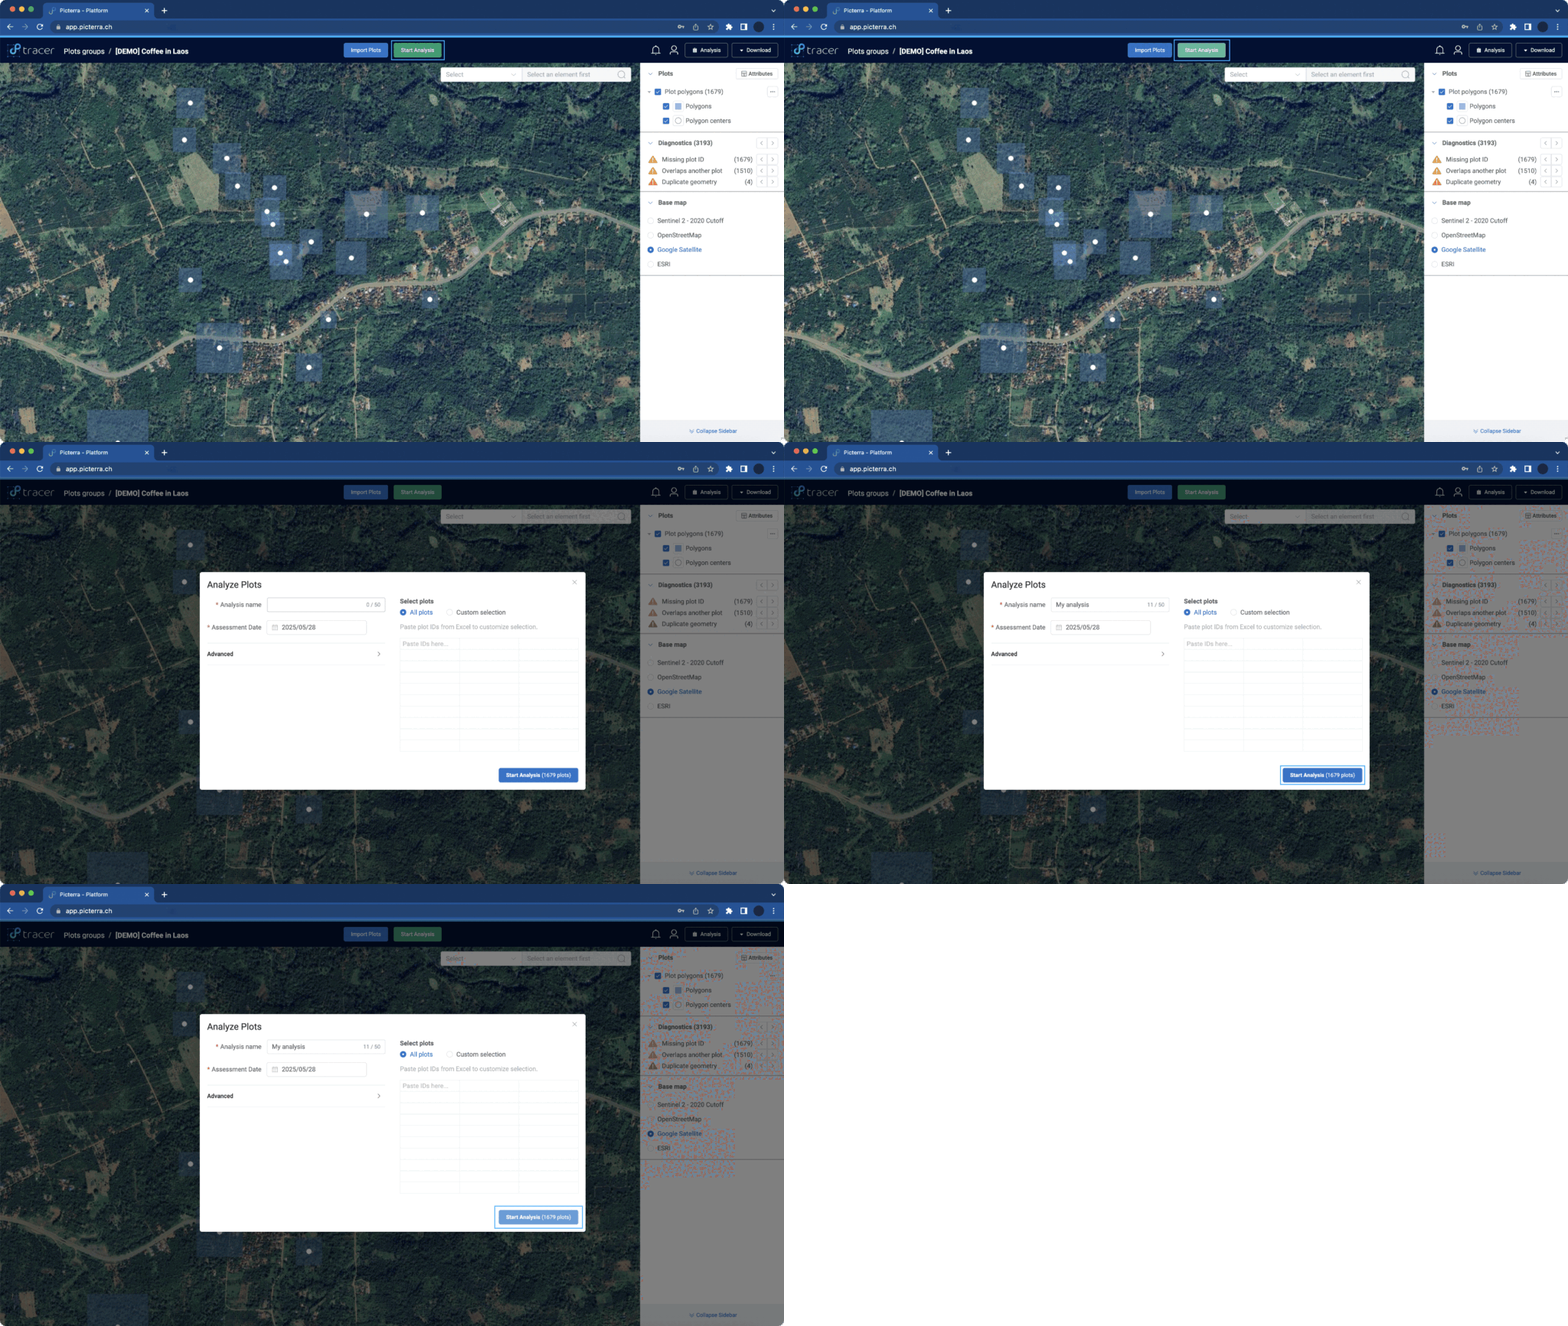
The Plot View enables users to analyze all plots or a specific selection. To access this feature, click the green “Start Analysis” button on the top bar. A popup will appear, allowing you to define the following:
- Analysis Name – Assign a clear identifier to your analysis.
- Assessment Date – Specify the date associated with this analysis.
- Select or Import Plots – By default, all plots are selected, but you can manually select or deselect individual plots or choose to select/deselect all.
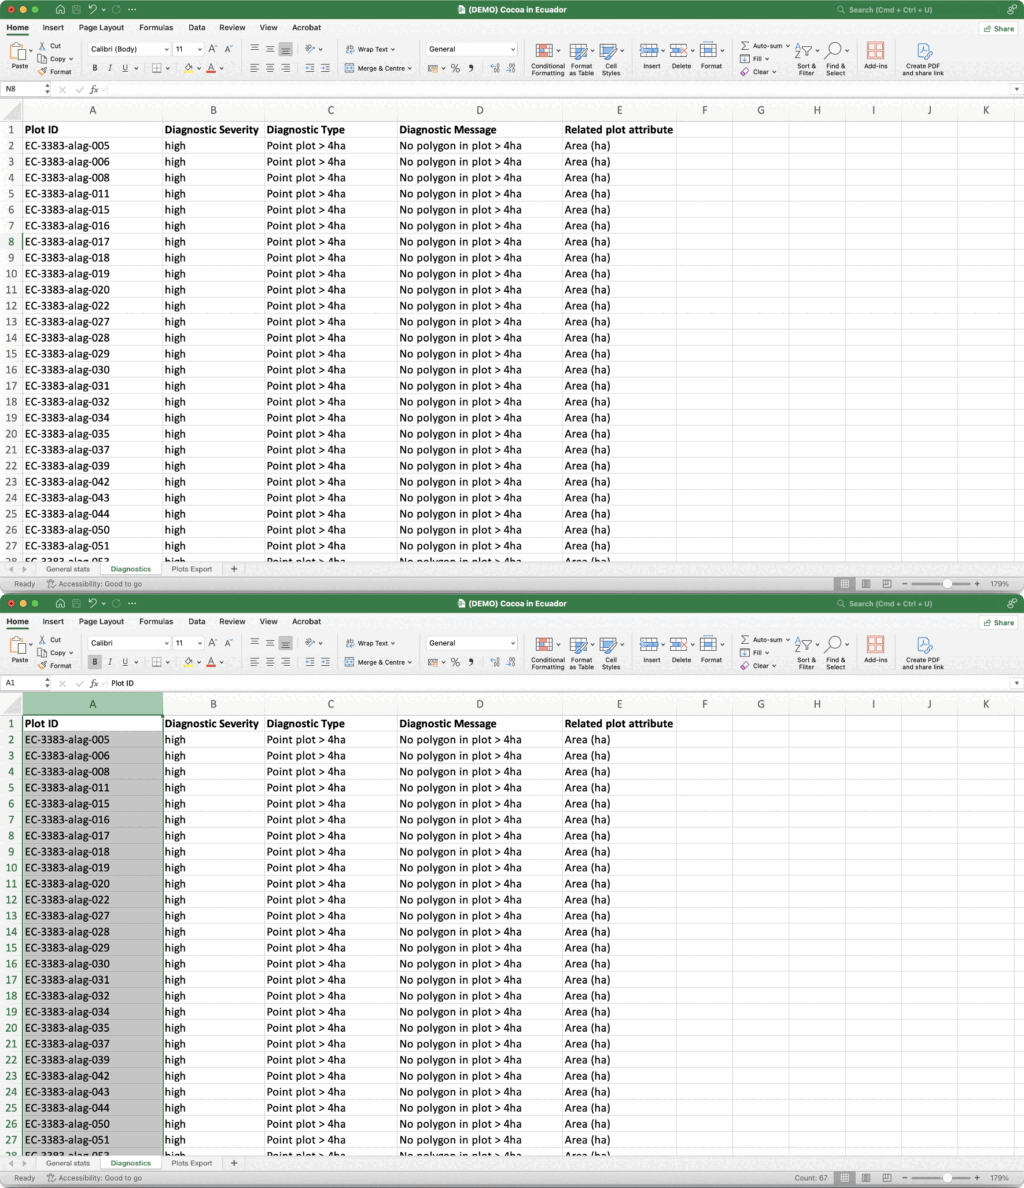
When working with large datasets, you can quickly select plots by copying plot IDs from Excel, CSV, or similar formats and pasting them into the table on the right-hand side.
Tip
Downloading plot groups in spreadsheet (CSV) format makes it easier to review the data and select specific subgroups to copy/paste for generating analysis.
After setting the analysis parameters, click the “Start Analysis” button in the bottom-right corner. Picterra Tracer will then begin analyzing your selected plots and notify you once the analysis is complete.
Analysis visualisation
You can access the list of all created analyses from the Plot View by clicking “Analysis” on the top bar. This will open a right-side pop-up displaying all analyses created so far.
Selecting an analysis will open it in a new tab, allowing you to visualize the results on a map with multiple layers, depending on the methodology used.
Each analysis will display a summary with key highlights and the list of layers used to conduct it.
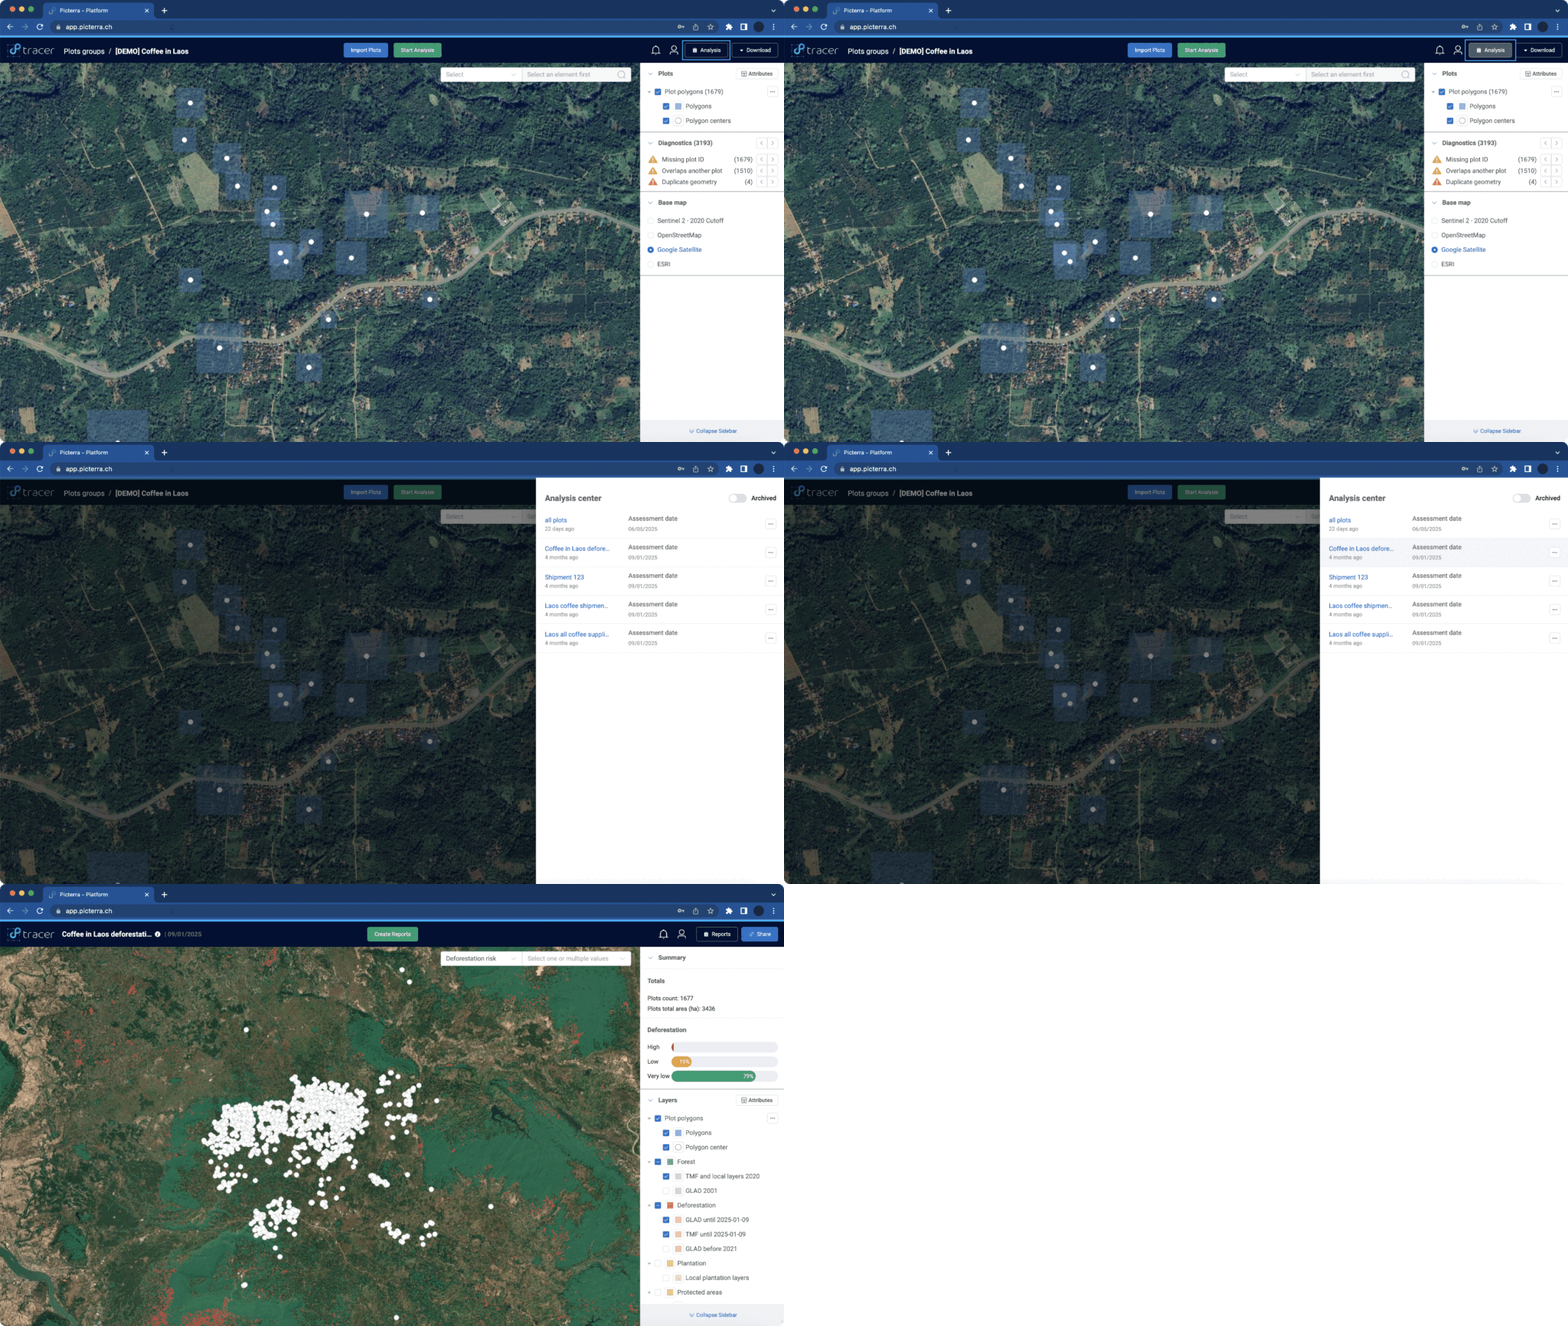
For example with EUDR deforestation analysis:
The Summary section includes:
- Number of plots analyzed
- Area analyzed in hectares (Ha)
- Main findings based on the methodology used – the summary will show statistics related to deforestation risk across the analyzed plots, categorized into high, medium, and low risk levels, and visualized in a graph.
The Layers section includes:
- Plot polygons
- Forest
- Deforestation
- Plantation
- Protected areas
overlaid on a selected Base map to visually support the analysis results.
Filtering options
Similar to the Plot View, the Analysis View allows you to navigate the findings using a two-factor search feature.
Attribute table
Like the Plot View, the Analysis View allows you to access Plot Attribute by clicking on a plot or by selecting the “Attributes” button in the right-side of the Layer panel.
Share Analysis
You can also easily share your analysis with internal and external users using the built-in sharing features.